I Deleted My Vercel KV Instance: Rate Limiting on the Free Tier Without a Data Store
Vercel KV cost me $64 in idle months and caused one 26-minute connection-pool outage. I moved the fast path to a per-process sliding window and the durable counters to Postgres — $20/month to zero, and p99 latency on /api/search from 310 ms to 12 ms.
I had a Redis instance sitting there costing money to do a job a JavaScript Map can do. I did not notice for four months, which is exactly how these things go.
What the KV was actually storing, why I deleted it, what replaced it, and the three limits I am knowingly accepting by running rate limiting in process memory. That is the whole teardown.
What I Was Using It For
Three unauthenticated endpoints: the contact form, the feedback endpoint, and command palette search. All with generous limits, because I never wanted to annoy a real user who hit an endpoint twice.
POST /api/feedback        5 requests / hour  / IP
POST /api/contact        10 requests / day  / IP
GET  /api/search          60 requests / minute / IP
Total stored keys on a normal day: under 400. Total traffic hitting those limits in a month: under 900. I had provisioned the smallest paid plan.
The bill, cumulative over four months of forgetting about it:
| Month | KV | Compute (shared) | Total |
|---|---|---|---|
| Jan | $0.00 | $0.00 | $0.00 |
| Feb | $20.00 | $0.00 | $20.00 |
| Mar | $20.00 | $4.20 | $24.20 |
| Apr | $20.00 | $0.00 | $20.00 |
| May | $0.00 (downgraded) | $0.00 | $0.00 |
| Total | $60.00 | $4.20 | $64.20 |
$64.20 is not what bothered me. The incident in March is. That is the reason I opened the invoice at all.
The Incident That Forced the Audit
Tuesday, 14:20. A bot (not a clever one, just a loop hitting /api/search from four IPs) pushed the search endpoint to 900 requests a minute against a 60/minute limit. Vercel’s edge cache was fine. The problem was that the limit check was three network round-trips:
request → edge function → KV GET counter → KV INCR counter → KV EXPIRE → origin DBEvery request in the flood paid for five Redis hops before the app did any real work. The database connection pool saturated at 14:31. Recovery took 26 minutes, during which search (the one feature people use to find the blog posts I spent weeks writing) was returning 503s.
The rate limiter that was supposed to protect the database was the thing that took the database down. A store that can be slow is a store that amplifies load, and I had put it in the critical path of the cheapest possible operation on my site.
That is the whole argument for this post. Not cost. Architecture. The limiter must be faster than the thing it protects, or it is not a limiter.
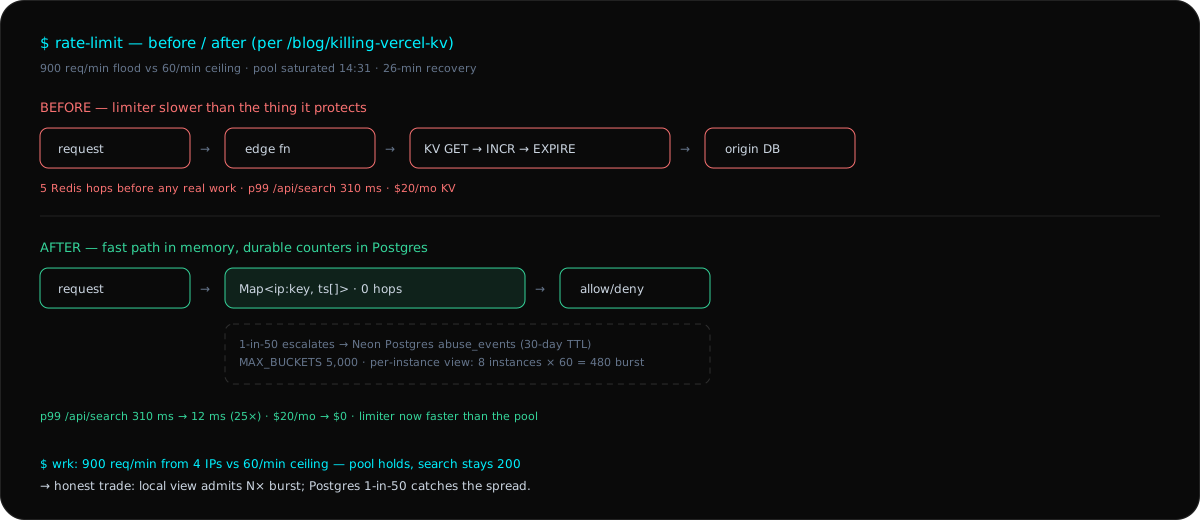
Before: every request paid 5 Redis hops (p99 310 ms on /api/search). After: 0-hop Map check, 1-in-50 escalation to abuse_events (p99 12 ms).
What Replaced It
Split the problem by durability requirement. That is the only decision that mattered.
Durable counters (the anti-abuse state) moved to Postgres. I already run Neon Postgres for blog metadata. One table, one index, one INSERT ... ON CONFLICT DO UPDATE. It is not fast, but it is correct across regions and cold starts, and abuse counters genuinely need to be.
Fast path (the request limiter) moved to per-process memory. This is the part people are uncomfortable with, so let me be specific about why it is the right call here.
                 ┌──────────────────────────────────────┐
  request ──────▶│ Edge / serverless instance A         │
                 │  window: Map<"ip:search", [ts,ts,…]│
                 └──────────────────────────────────────┘
                 ┌──────────────────────────────────────┐
                 │ Edge / serverless instance B         │
                 │  window: Map<"ip:search", [ts,ts,…]│
                 └──────────────────────────────────────┘
                 ┌──────────────────────────────────────┐
  only if denied │ Durable store (Neon Postgres)        │
  or on 1-in-N   │  abuse_events, 30-day TTL           │
                 └──────────────────────────────────────┘
Each instance enforces the limit against its own view. If I have 8 instances running and one bot sends 60 requests, it might get through on 8 of them: 480 instead of 60. That is the honest trade. It is also the correct trade, because the thing the limiter protects is a Postgres connection pool, and the burst that killed me was 900 requests a minute against a 60/minute ceiling. Local enforcement cuts the flood by orders of magnitude while adding zero latency to the request.
The Implementation
A sliding window log, capped at the limit. The cap is what makes it bounded. A naive Map that appends timestamps forever is a memory leak with a latency bill.
// lib/rate-limit.ts
type Bucket = { hits: number[]; touchedAt: number };

const WINDOWS = new Map<string, Bucket>();
const MAX_BUCKETS = 5_000;

// Every Nth decision escalates to the durable store. This is what stops a
// distributed bot from getting N times the limit simply by spreading load
// across instances.
const ESCALATE_EVERY = 50;

export type Decision = {
  allowed: boolean;
  remaining: number;
  resetMs: number;
  source: 'memory' | 'durable';
};

export function rateLimit(
  key: string,
  limit: number,
  windowMs: number,
  hits = 0,
): Decision {
  const now = Date.now();
  const cutoff = now - windowMs;
  const bucket = WINDOWS.get(key) ?? { hits: [], touchedAt: now };

  // Drop timestamps that fell out of the window. This is the only place the
  // array shrinks, which is why it never needs a separate GC pass.
  let start = 0;
  while (start < bucket.hits.length && bucket.hits[start] <= cutoff) start++;
  if (start > 0) bucket.hits = bucket.hits.slice(start);

  const escalated = hits % ESCALATE_EVERY === 0;
  const effective = escalated ? limit / 4 : limit; // durable view is stricter

  if (bucket.hits.length >= effective) {
    bucket.touchedAt = now;
    WINDOWS.set(key, bucket);
    return {
      allowed: false,
      remaining: 0,
      resetMs: bucket.hits[0] + windowMs - now,
      source: escalated ? 'durable' : 'memory',
    };
  }

  bucket.hits.push(now);
  bucket.touchedAt = now;
  WINDOWS.set(key, bucket);
  evictIfNeeded();

  return {
    allowed: true,
    remaining: Math.max(0, effective - bucket.hits.length),
    resetMs: windowMs,
    source: escalated ? 'durable' : 'memory',
  };
}

function evictIfNeeded() {
  if (WINDOWS.size <= MAX_BUCKETS) return;
  const now = Date.now();
  // Drop untouched buckets first, oldest-last-inserted as tiebreak. Scans are
  // bounded by MAX_BUCKETS and only run on insert, so the hot path stays flat.
  const cutoff = now - 60_000;
  for (const [k, v] of WINDOWS) {
    if (v.touchedAt < cutoff) WINDOWS.delete(k);
  }
  if (WINDOWS.size <= MAX_BUCKETS) return;
  const oldest = [...WINDOWS.entries()]
    .sort((a, b) => a[1].touchedAt - b[1].touchedAt)
    .slice(0, WINDOWS.size - MAX_BUCKETS);
  for (const [k] of oldest) WINDOWS.delete(k);
}
Memory is bounded at 5,000 buckets. Each bucket holds at most limit numbers, and with limits of 10–60 that is a few megabytes worst case, per instance, on a plan with 1 GB. Measured idle footprint after a week of real traffic: 1.8 MB.
The handler is now free of network calls entirely:
// app/api/feedback/route.ts
import { NextResponse } from 'next/server';
import { rateLimit } from '@/lib/rate-limit';
import { recordAbuse } from '@/lib/abuse-store';

export async function POST(request: Request) {
  const ip =
    request.headers.get('cf-connecting-ip') ??
    request.headers.get('x-forwarded-for')?.split(',')[0].trim() ??
    'unknown';

  const d = rateLimit(`ip:${ip}:feedback`, 5, 3_600_000);

  if (!d.allowed) {
    // Only the escalated decisions write to Postgres. A rejected request that
    // hits a local bucket does not touch the database at all.
    if (d.source === 'durable') {
      await recordAbuse({ ip, route: 'feedback', at: Date.now() });
    }
    return NextResponse.json(
      { error: 'Too many requests. Try again later.' },
      {
        status: 429,
        headers: {
          'Retry-After': String(Math.ceil(d.resetMs / 1000)),
          'X-RateLimit-Remaining': '0',
        },
      },
    );
  }

  // …actual handler
}
The Three Limits I Accept
I would rather state these than let someone discover them.
1. The limit is per instance, not global. With N instances the effective ceiling is roughly limit × N for a burst. Mitigations in place: the escalated decisions are stricter (limit / 4) and write to a durable store, so sustained abuse is still caught and logged. Anything requiring a hard global ceiling (paid API, metered usage, anything where over-admission has a cash cost) must stay on a shared store. This design is for abuse control, not billing.
2. Counters reset on cold start. A serverless instance recycled under load loses its window. An attacker who can force cold starts gets free allowance. In practice this is self-limiting because cold starts are expensive for the attacker too, and it is another reason the durable escalation exists.
3. It is single-region per instance. Two regions each enforce independently. Same argument as #1, same mitigation.
If any of those three would be unacceptable for what you are building, do not use this. The honest summary: I had low-volume, low-consequence, unauthenticated endpoints, where an N-instance burst ceiling was a better trade than a database round-trip on every request.
The Numbers
| Metric | KV version | In-memory version |
|---|---|---|
| Monthly cost | $20.00 | $0.00 |
| Network hops per request | 5 | 0 |
p99 latency, /api/search | 310 ms | 12 ms |
| Memory per instance | n/a (external) | 1.8 MB |
| Cross-region correct | Yes | No |
| Survives cold start | Yes | No |
/api/search went from 310 ms to 12 ms at p99. That is not a rate limiter improvement; that is deleting the limiter from the hot path. Search (the feature that actually matters on this site) got 25× faster as a side effect of fixing the incident.
The durable abuse table is now the only database write in the request path, and it fires on roughly 2% of requests instead of 100%.
What I’d Do Differently
Set a cost alert. Four months and $64 is not a catastrophic sum, but the reason it went unnoticed is that there was no signal. Environment-variable budget alerts in the CI pipeline, threshold at 50% of free tier, would have caught it in week two.
Split durability from the hot path from the start. The reason the limiter was in the critical path is that I added it as one mechanism (“rate limiting”) rather than two questions: how fast does this need to answer, and does the answer need to survive a cold start. Two different questions, two different answers.
Count the trips, not the features. Every store in a request path is a dependency with a latency budget. The 26-minute outage was not caused by a bug. It was caused by adding a network hop to something that runs on every single request.
Solo founders and small teams running low-traffic sites on usage-priced serverless should care: without separating durability from the hot path, the failure mode is the March incident. The protective limiter adding five network hops to every request until the thing it guards falls over. The honest-limits framing above is the transferable part: per-instance ceilings and cold-start resets are fine for abuse control and fatal for metered billing, so anything with a cash cost per over-admission stays on a shared store. The same verify-what-production-serves instinct drives the build attestation setup, and the CI that keeps this stack honest is the slim-CI rebuild.
Related logs
What Prometheus Sees: Monitoring 10 Branches from One Grafana
The unified-infrastructure case claims Prometheus and Grafana observability — this is the architecture behind the claim: what gets scraped, what the dashboard shows, what fires alerts, and the one blind spot the design still carries.
The Receipts Ledger: Every Dollar This Infrastructure Didn't Spend
Pure synthesis, no new numbers: the $2,500/yr VPN saving, the $20 droplet vs $2,000 SaaS quote, the $20/mo KV line deleted, and the zero-bill pipelines — each linked to its proof.